Prometheus 是一款开源监控系统,能监控容器、应用、系统、服务、应用等
Prometheus 架构
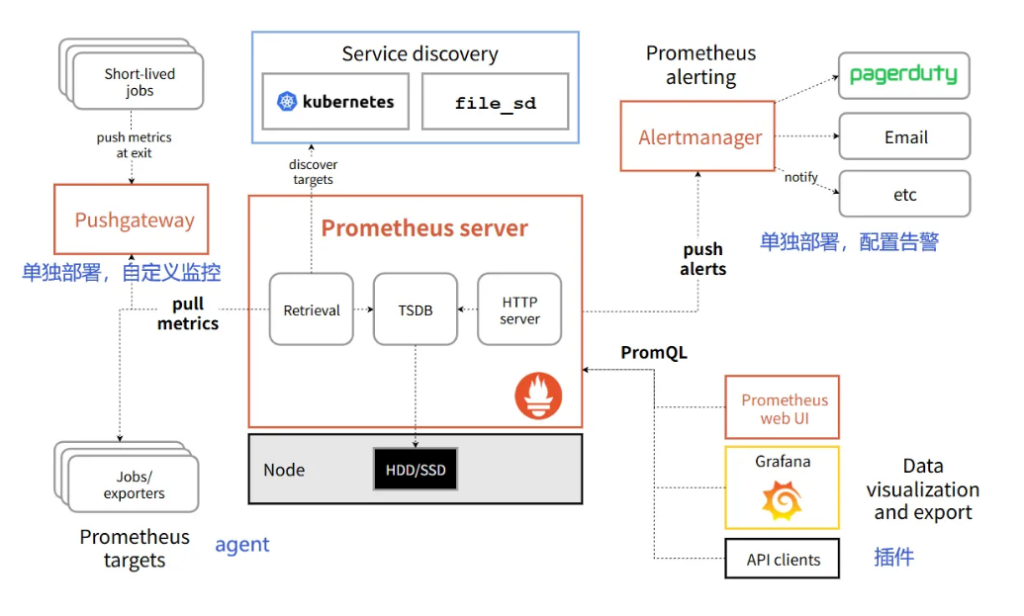
Prometheus 监控的流程
1.客户端需要暴露metrics指标,因此需要下载对应的 exporter;

2.prometheus server端需要配置要监控的目标(服务发现);

3.热加载配置文件;

4.检查Prometheus的WebUI验证配置是否生效;

5.grafana导入模板ID;

6.grafana的Dashboard出图展示;

7.配置相应的告警规则;
Prometheus 服务端安装
一键脚本安装
#通过网盘分享的文件:prometheus-install-server-v2.53.3.tar.gz
链接: https://pan.baidu.com/s/1wxqn6dgFE1ucqR4hcgSLWQ?pwd=wc2r 提取码: wc2r

tar xvf prometheus-install-server-v2.53.3.tar.gz
chmod +x install-prometheus-server.sh
#安装为 i  卸载则是 r
./install-prometheus-server.sh i

#访问测试,能访问则表示成功
http://10.0.0.235:9090/
Prometheus 客户端安装
官网寻找合适的 exporter ,来监控应用的 metrics
https://prometheus.io/docs/instrumenting/exporters
Grafana 安装部署
#参考链接
https://grafana.com/grafana/download/9.5.21

通过网盘分享的文件:grafana-enterprise-9.5.21-1.x86_64.rpm
链接: https://pan.baidu.com/s/1Eh7plCDpwUBXxj83L5oLJA?pwd=wmeb

rpm -ivh grafana-enterprise-9.5.21-1.x86_64.rpm
systemctl start grafana-server.service
systemctl enable grafana-server.service
systemctl status grafana-server.service
netstat -lntup | grep 3000
#访问测试,部署完成!
http://10.0.0.235:3000/
admin admin访问:http://10.0.0.235:3000/ admin admin
官方模版库 : https://grafana.com/grafana/dashboards/
监控Linux主机案例
编号 1860 编号 1860 编号 1860
1、需要安装 node-exporter 使用一键部署脚本即可
通过网盘分享的文件:install-node-exporter.tar.gz
链接: https://pan.baidu.com/s/13ckeMgaf5pcfByxGKagTGQ?pwd=i6cn 提取码: i6cn

chmod +x install-node-exporter.sh
./install-node-exporter.sh i
#即可完成部署 访问测试 http://10.0.0.250:9100/metrics
2、修改Prometheus server的配置文件,添加 node-exporter 我这里以 harbor 为案例
vim /softwares/prometheus-2.53.4.linux-amd64/prometheus.yml
scrape_configs:
  # The job name is added as a label `job=<job_name>` to any timeseries scraped from this config.
  - job_name: "prometheus"

    # metrics_path defaults to '/metrics'
    # scheme defaults to 'http'.

    static_configs:
      - targets: ["localhost:9090"]


# 要注意格式,要对齐 不然会报错
  - job_name: "harbor250-node-exporter"
    static_configs:
       - targets:
         - 10.0.0.250:9100
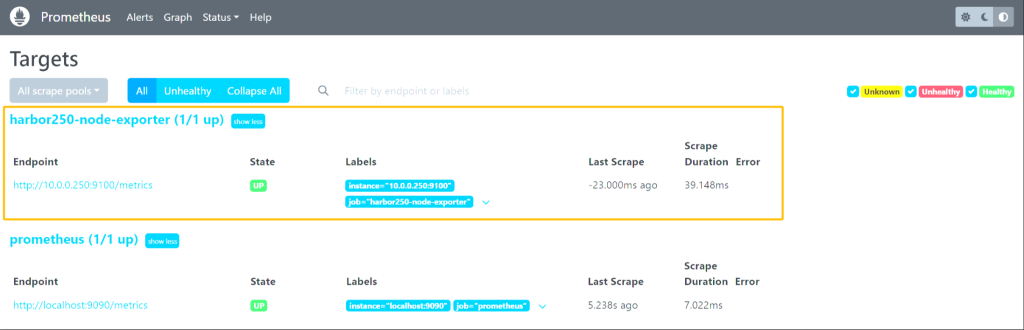
3、 热加载
curl -X POST http://10.0.0.235:9090/-/reload
#若无报错则可以去 http://10.0.0.235:9090/targets 查看是否成功加入
成功获取!!!!
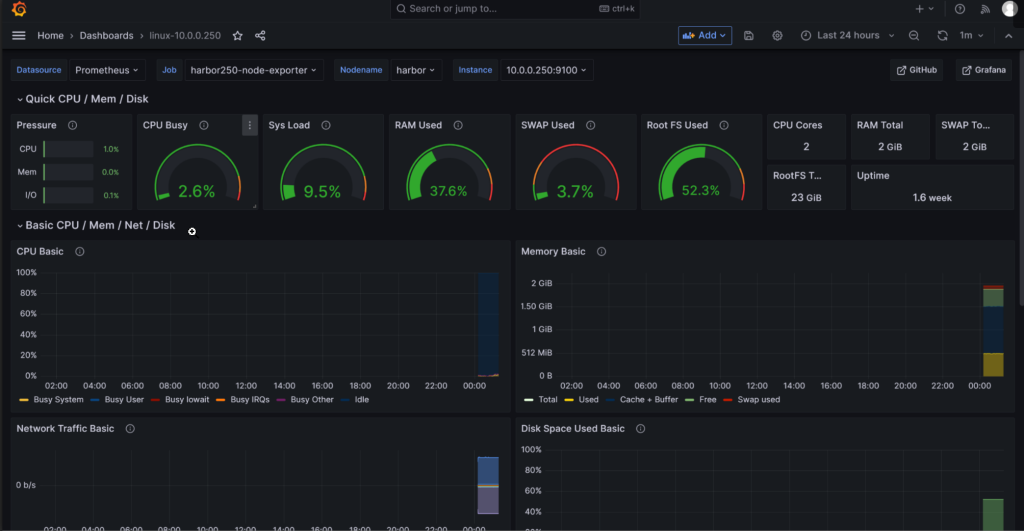
4、Grafana 导入官方模版号 1860
监控 Windows 主机案例
模版号:20763 14694
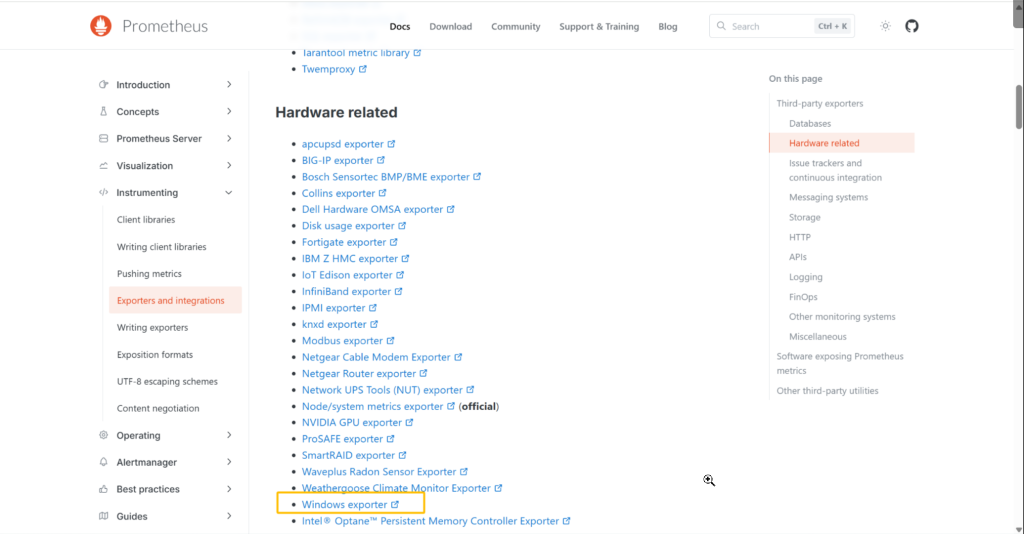
1、 官网寻找合适的 exporter
https://prometheus.io/docs/instrumenting/exporters
2、找到 windows 的 exporter
https://github.com/prometheus-community/windows_exporter/releases/tag/v0.31.3
3、运行客户端
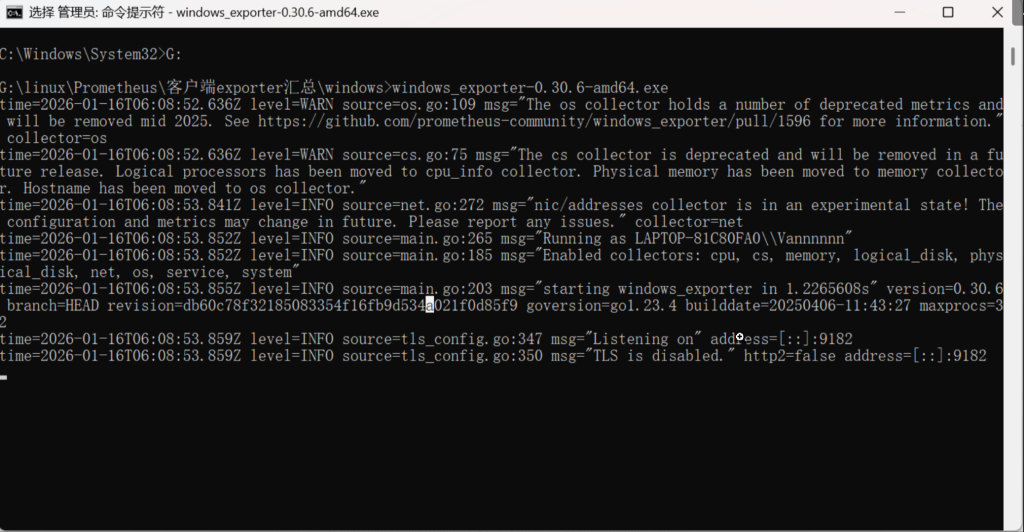
4、访问测试
5、在服务端 添加配置
vim /softwares/prometheus-2.53.3.linux-amd64/prometheus.yml

  - job_name: "windows-node-exporter"
    static_configs:
       - targets:
         - 10.0.0.1:9182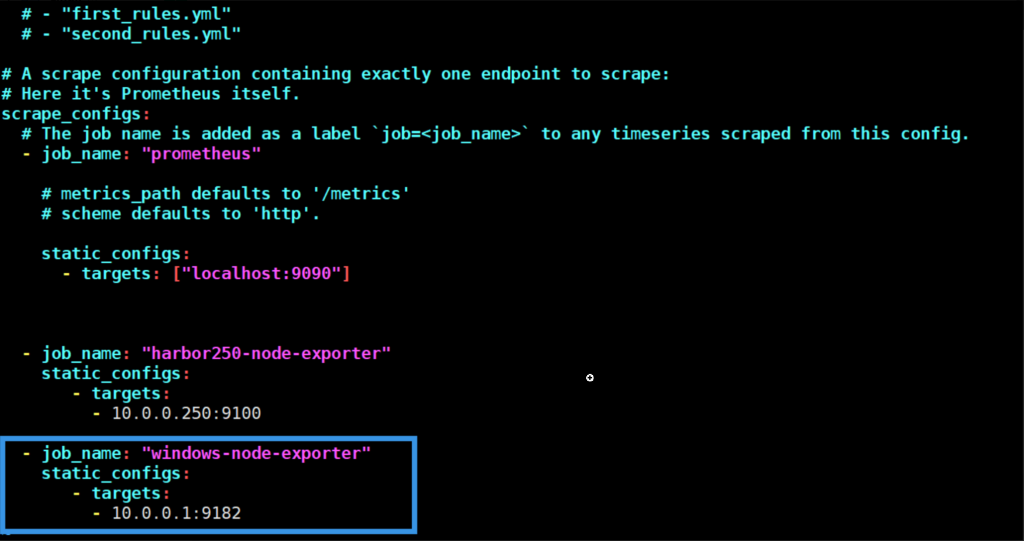
6、热加载配置
curl -X POST 10.0.0.31:9090/-/reload
访问server端验证node是否加入成功
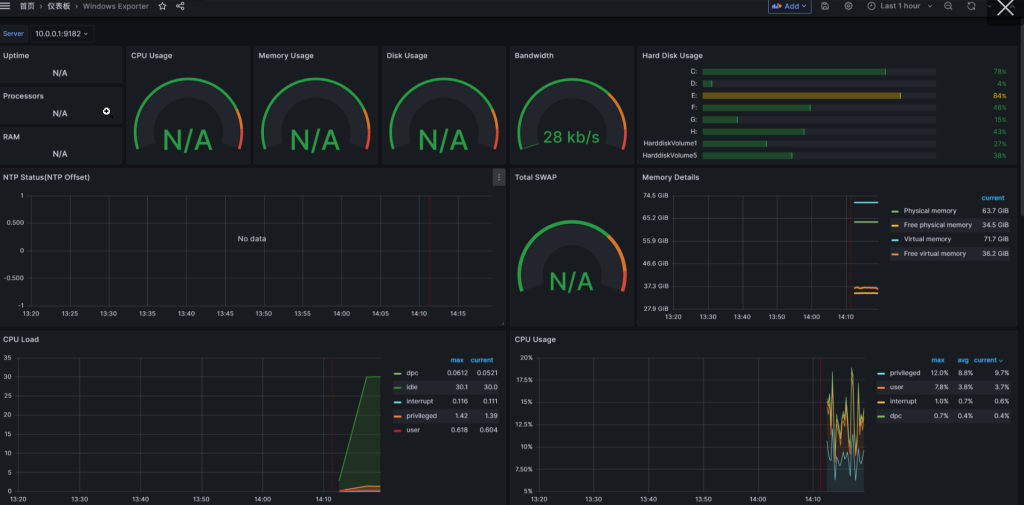
http://10.0.0.235:9090/targets?search=7、Grafana 导入 dashboards
20763
14694
8、监控完成
监控 docker 容器案例
客户端
1、安装 docker 与 docker-compose 环境 / 这里直接用脚本梭哈即可
2、安装cadvisor 镜像用来 取 metrics
通过网盘分享的文件:cadvisor-v0.52.1.tar.gz
链接: https://pan.baidu.com/s/1_WtB47O0P_5HY3MYosJlHA?pwd=gh2f 提取码: gh2f

docker load -i cadvisor-v0.52.1.tar.gz
3、客户端运行 cadvisor
docker run \
  --volume=/:/rootfs:ro \
  --volume=/var/run:/var/run:ro \
  --volume=/sys:/sys:ro \
  --volume=/var/lib/docker/:/var/lib/docker:ro \
  --volume=/dev/disk/:/dev/disk:ro \
  --network host \
  --detach=true \
  --name=cadvisor \
  --privileged \
  --device=/dev/kmsg \
  gcr.io/cadvisor/cadvisor-amd64:v0.52.1
4、 验证测试
http://10.0.0.250:8080/metrics
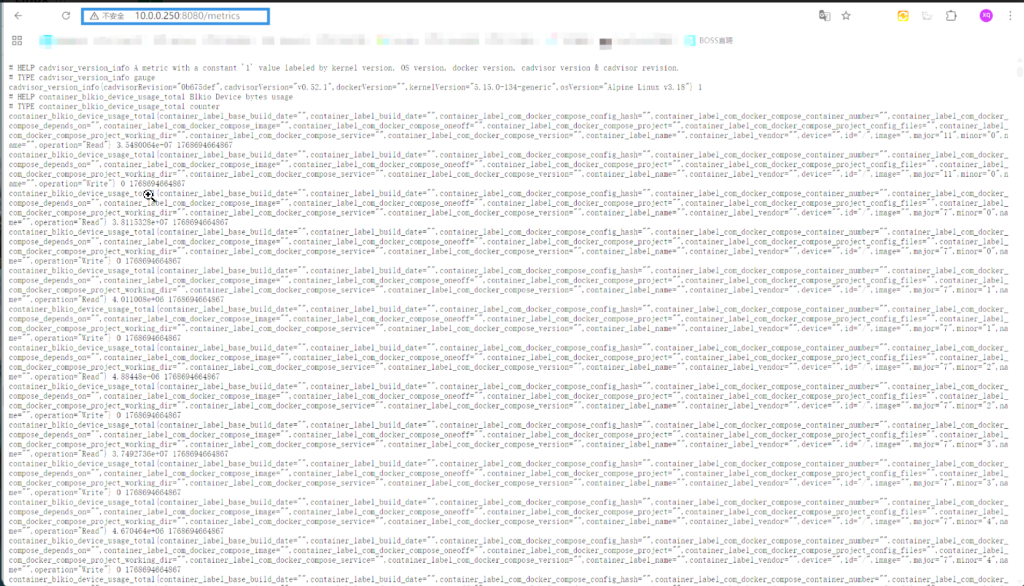
curl -s http://10.0.0.250:8080/metrics | wc -l
3943
#成功获取到 metrics
服务端
5、配置 prometheus.yml 添加项目
vim prometheus.yml

  - job_name: "harbor-docker-cadVisor"
    static_configs:
      - targets:
          - 10.0.0.250:8080

#热加载服务端
curl -X POST 10.0.0.235:9090/-/reload
6、Grafana 导入模板 ID
10619
7、PromQL语句优化
目的是为了 以后增删容器后 也能更新容器
	- 1.PromQL语句优化
		count(last_over_time(container_last_seen{instance=~"$node:$port",job=~"$job",image!=""}[3s]))

	- 2.Value options
		将'Calculation'字段设置为'Last *'即可。

	- 3.保存Dashboard
		若不保存,刷新页面后所有配置丢失!!!