什么是 Prometheus 服务发现
我的理解:服务端如何发现客户端,或者说是监控端与被监控端如何交互

AI 回答:Prometheus服务发现是其自动查找并添加需要监控的目标(如服务器、容器)的功能
Prometheus 服务发现的三种方式
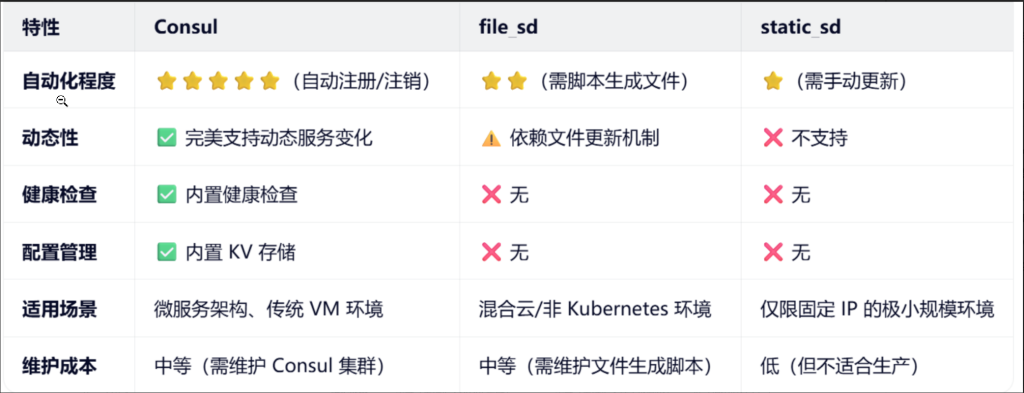
1、静态配置 static_configs
2、动态配置 file_sd_configs
3、注册中心 consul_sd_configs
Prometheus 在不同环境的实现方式
| 环境 | 推荐方式 | 实现方式 | 优势 |
| Kubernetes | kubernetes_sd_configs + Prometheus Operator | ServiceMonitor/PodMonitor | 自动发现、标签管理、无手动配置 |
| 非 Kubernetes | file_sd_configsconsul_sd_configs | Ansible/Terraform 生成目标文件Consul + Prometheus | 自动化、无硬编码、适合混合架构 |
静态配置 static_configs
vim /softwares/prometheus-2.53.3.linux-amd64/prometheus.yml

  - job_name: "harbor250-node-exporter"
    static_configs:
       - targets:
         - 10.0.0.250:9100

  - job_name: "windows-node-exporter"
    static_configs:
       - targets:
         - 10.0.0.1:9182


  - job_name: "harbor-docker-cadVisor"
    static_configs:
      - targets:
          - 10.0.0.250:8080
动态配置 file_sd_configs
参考链接:https://prometheus.io/docs/prometheus/latest/configuration/configuration/
vim /softwares/prometheus-2.53.3.linux-amd64/prometheus.yml

#动态文件配置
  - job_name: "file-sd-configs"
    file_sd_configs:
      - files:
          - /softwares/prometheus-2.53.3.linux-amd64/xixi.json
          - /softwares/prometheus-2.53.3.linux-amd64/haha.yaml

#热加载服务
curl -X POST http://10.0.0.235:9090/-/reload

#配置xixi.json 或 haha.yaml , 写两个的原因是 因为支持两种格式
#修改json格式文件
cat > /softwares/prometheus-2.53.3.linux-amd64/xixi.json <<EOF
[
  {
    "targets": [ "10.0.0.250:9100" ],
    "labels": {
      "type": "Linux server"
    }
  }
]
EOF
#访问 http://10.0.0.235:9090/targets 验证服务是否发现

#修改haha.yaml格式文件
cat > /softwares/prometheus-2.53.3.linux-amd64/haha.yaml <<EOF
- targets:
  - '10.0.0.250:9100'
  - '10.0.0.250:9100'
  labels:
    type: Linux server
EOF

#访问 http://10.0.0.235:9090/targets 验证服务是否发现
注册中心 consul_sd_configs
官方文档:
https://developer.hashicorp.com/consul/install#linux
下载软件包
通过网盘分享的文件:consul_1.21.3_linux_amd64.zip
链接: https://pan.baidu.com/s/1YxlQ5O6dqTgfgjfiW2Q_Pw?pwd=n4uw 提取码: n4uw
解压
unzip consul_1.21.3_linux_amd64.zip -d /usr/local/bin/
运行 consul 服务端兼客户端:
consul agent -server -bootstrap -bind=10.0.0.250 -data-dir=/softwares/consul -client=10.0.0.250 -ui
客户端:
consul agent -bind=10.0.0.xx -data-dir=/softwares/consul -client=10.0.0.xx -ui -retry-join=10.0.0.250查看各节点的监听端口
#8300 用于接收客户端的数据 8500 用于 WebUi
ss -ntl | egrep “8300|8500”
访问console服务的WebUI
http://10.0.0.250:8500/ui/dc1/nodes
Prometheus 服务端配置 consul 服务发现
vim /softwares/prometheus-2.53.3.linux-amd64/prometheus.yml

#基于consul服务发现

  - job_name: "consul-seriver-discovery"
    # 配置基于consul的服务发现
    consul_sd_configs:
        # 指定consul的服务器地址,若不指定,则默认值为"localhost:8500".
      - server: 10.0.0.250:8500
      - server: 10.0.0.xxx:8500   #客户端IP
      - server: 10.0.0.xxx:8500   #客户端IP
    relabel_configs:
        # 匹配consul的源标签字段,表示服务名称
      - source_labels: [__meta_consul_service]
        # 指定源标签的正则表达式,若不定义,默认值为"(.*)"
        regex: consul
        # 执行动作为删除,默认值为"replace",有效值有多种
        #   https://prometheus.io/docs/prometheus/latest/configuration/configuration/#relabel_action
        action: drop
热加载配置
curl -X POST http://10.0.0.235:9090/-/reload
被监控节点注册到console集群
注册节点
curl -X PUT  http://10.0.0.250:8500/v1/agent/service/register \
 -d '{
"id":"10.0.0.250-harbor",
"name":"10.0.0.250-harbor",
"address":"10.0.0.250",
"port":9100,
"tags":["node-exporter"],
"checks": [{"http":"http://10.0.0.250:9100","interval":"5m"}]
}'
注销节点
curl -X PUT http://10.0.0.250:8500/v1/agent/service/deregister/10.0.0.250-harbor